Showing posts with label Gartner. Show all posts

Monday, February 11, 2013

Understanding Gartner research methodologies

Gartner is one of the world's leading information technology research and advisory company. Commonly Gartner reports are read by CxO level executives and decision makers and they provide a good view of what is happening in the world of technology at this moment and what the upcoming trends are. The current Gartner market research is focussed around a number of methodologies. Understanding the methodologies can be important. It can be important if you are a technology vendor and Gartner is conducting research in your field. Due to the common audience of Gartner reports it can be a game changer if Gartner positions you favourable.

Next to this understanding the Gartner methodologies can be important if you are a CxO executive and want to make a decision and would like to make use of the reports from Gartner. Understanding the reports correctly and interpreting them correctly is in this case of vital importance.

A third group of people reading the Gartner reports are market analysts, technology analysts and entrepreneurs. Gartner reports are helping you to understand the current technology market and the way emerging technologies are heading.

Gartner describes it's methodologies as follows;
Our proprietary research processes allow us to see IT as it pertains to the evolving business landscape. Our research methodologies are based on our years of experience observing trends and scientifically mapping technology's progress against true delivery. 

 The success of our proprietary methodologies lies in distilling large volumes of data into clear, precise, actionable insight and advice so our clients can formulate plans or make difficult business decisions. 
The observations and recommendations delivered through our proven methodologies ensure that you make decisions about the business applications of IT with higher levels of confidence. 

Our clients make important multi-year technology investments in the face of uncertainty and risk. Our methodologies help our clients reduce and manage that risk, and enable them to succeed in their roles as they mobilize IT to contribute to their organization's business objectives.

The main research methodologies used by Gartner are; Hype Cycles, Magic Quadrant, MarketScopes, ITScores, Vendor Ratings, Market Forecasts, Market Share Analysis and IT Market Clocks. All are proprieatary to Gartner.

Hype cycles:
When new technologies make bold promises, how do you discern the hype from what’s commercially viable? And when will such claims pay off, if at all? Gartner Hype Cycles provide a graphic representation of the maturity and adoption of technologies and applications, and how they are potentially relevant to solving real business problems and exploiting new opportunities. Gartner Hype Cycle methodology gives you a view of how a technology or application will evolve over time, providing a sound source of insight to manage its deployment within the context of your specific business goals.

Magic Quadrant:
Who are the competing players in the major technology markets? How are they positioned to help you over the long haul? Gartner Magic Quadrants are a culmination of research in a specific market, giving you a wide-angle view of the relative positions of the market's competitors. By applying a graphical treat­ment and a uniform set of evaluation criteria, a Gartner Magic Quadrant quickly helps you digest how well technology providers are executing against their stated vision.

MarketScopes:
When markets are growing and IT solutions are stable, Magic Quadrants provide the best tool for understanding how the players are competitively positioned. But when new markets emerge and user requirements are in flux, solutions are often approached in wildly different ways, making a competitive positioning less useful. Mature markets present a similar challenge, as the differentiators among consolidating technology providers and solutions grow more difficult to discern.

ITScores:
Gartner ITScores are holistic sets of interactive maturity assessments designed to help CIOs and IT leaders evaluate the maturity of both the IT organization as a provider of IT services, and the enterprise as a consumer of information technology. Unlike other IT maturity assessments, a Gartner IT Score measures your organization's capabilities within the context of an enterprise culture, behaviors and capacity for leadership - factors that dramatically impact IT's effectiveness and it's ability to contribute real business value.

Vendor Ratings:
Clients use our well-defined methodology to rate IT technology providers—large, small, public or private. Gartner Vendor Ratings assess all the different aspects of a technology provider, such as its strategy, organization, products, technology, marketing, financials and support. These ratings are periodically revised to reflect changes in assessment when a significant internal or external event directly affects the provider.

Market Forecast:
How do you quantify the impact of a market’s business drivers? Is a market growing, retreating or flat? The best answers come from an analysis of both supply and demand, comparing technology investment trends in the provider community with the spending trends of end users. It’s a unique picture you get from Gartner, based on our relationships with thousands of end users and providers. And it’s a view you can’t get anywhere else.

Market Share Analysis:
Understanding market share is one of the most important metrics used by executives in any business. Through our Market Share Analysis methodology, clients see how share is allocated among 400 technology providers in 37 key markets. Our detailed analysis of how provider revenue is allocated reveals what types of solutions are succeeding, which are trailing and where opportunities exist for providers to take additional share.

Market Clocks:
The useful life of every technology product or service has an end, beyond which it will be more cost-effective to retire and replace the asset than to continue maintaining it. Gartner IT Market Clocks are decision frameworks that provide a full life cycle view of technology assets - whether capabilities, products or services. They help you better evaluate the technology assets you are responsible for, so you can prioritize IT investments and build technology road maps that support business plans.

Friday, February 18, 2011

Excel Magic Quadrant

When you are working in the IT business you have come across the magic quadrants from Gartner. Gartner uses this way of visualizing prefects or vendors and giving them a place in the market. Gartner states the following about the magic quadrant: "Gartner's Magic Quadrant research methodology provides a graphical competitive positioning of four types of technology providers in fast-growing markets: Leaders, Visionaries, Niche Players and Challengers. For emerging or mature markets, Gartner's MarketScopes are the best tool to help clients understand how the status of an emerging or mature market aligns with their own state of maturity and future plans."

My personal opinion is that the magic quadrant is great to show the information in a single graph, and combined with the knowledge from Gartner and information from your own company you can make a solid decision as a CxO. However, the magic quadrant way of visualizing can be used for so much more than only they way Gartner is using it. I am currently falling inn love with this way of representing information and I recently started to use it to visualize for example the maturity of systems in combination with the business value they represent. This is working great during meetings as you can show a lot of systems in one graph in a way that is also understandable for none tech people.
The idea came after some talks on how to represent data in a none-tech way and we came up with a gartner magic quadrant way of representing the information. Considering you will most likely have only a limited number of tools on your laptop you will most likely be bound to the options to draw such a image in Microsoft powerpoint or to make a graph in Microsoft excel. I have used Microsoft Excel for this task because I could make a framework which can be used for all future graphs I will need. below I explained how this can be done, please note in the example I will be using Microsoft Excel 2011 (version 14.0.2 build 101115) on a mac. The point that it is on a mac will not be that hard to overcome, only the graphs look a little different however the 2011 part you might want to consider if something is not working as expected.


Step 1.
first step is to get your data in a correct format. if you like to create a framework for future use you might want to reserver some space in your sheet where you can enter the data. On the X axis you please reserver 2 columns for your data. one for the values of (in the example of a Gartner magic quadrant) "completeness of vision" and one for "Ability to execute" On the Y axis you can place the product/vendor names. Before you enter your data you should think about the scale of things, you want to have a pre-defined scale on which you will be plotting 0 till 10 might be a good option however you can pick any scale you like. I have picked 0 till 7 due to some internal metric which is based upon this scale. This way you should en up with a nice formatted place to store your data, something like the example below:

Step 2
Your second step would be to introduce a standard bubble chart. this is standard within excel, the thing you need to take into account is that you will need to do some extra setup when selecting your data. you need to create series for every line of data you created in step 1. If you would create a framework you can do a lookup to the cell for every value of the X and Y axis and the name. You will end up with something like the below example.
Step 3.
A bubble chart is by default using a automatic horizontal and vertical axis scale which you do not want to have in this example. You want to devoid your graph in 4 equal parts where everything below a certain figure is in a certain area of your graph so you have to unset the auto scale function on your axis. Tis can be done with the format axis option of your chart. It is advisable to set the max 1 point higher than the scale you defined in step 1 and the min one point lower. This ensures that a bubble which is on the lowest (or highest) part of your scale will not be shown half because it is falling of your plot area. In the below example you can see the settings for a scale 0 till 7. After you have set you scale you want to remove the axis from the plot area so you will not see it (or need it).
Step 4.
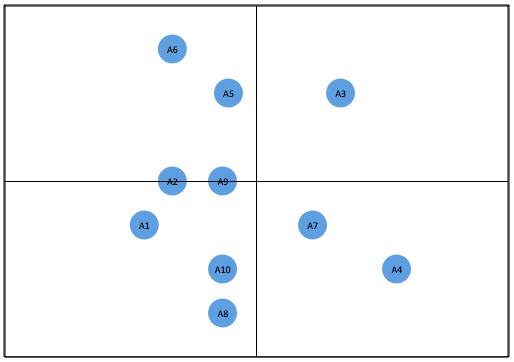
In principle your magic quadrant is now done. All you have to do is some design steps. You should remove the grid lines and draw a box around your plot area. After that you need to draw a cross with vertical and horizontal lines from the middle of your box. Now you can see the magic quadrant coming to what you expect of it. From a design perspective you might want to shrink the size of the bubbles and add labels to it and position them on the left, the right, the center or any other position in respect of the bubble you feel conferrable with. You might want to do all kinds of other design things however the result till now will look something like the below example:


Wednesday, January 14, 2009

CapGemini, Gartner Magic Quadrants

A couple of posts ago I wrote about Gartner's Magic Quadrant and how Oracle placed itself in CPM, just read this blogpost to see what I am referring to.

It is nice to know that the model for offshoring done by CapGemini is working and is recognized by Gartner in such in way that it is deserving a place in the Magic Quadrant.

"In the report, Gartner uses its unique Magic Quadrant to evaluate the strengths of IT solutions providers operating in the European Offshore Application Services market. Providers are placed within the quadrant based on their ratings along two axes: their ability to execute and the completeness of their vision."

CapGemini is using a Rightshore model where not everything is moved over to India but when a customer decides that he want to outsource some or all its IT activities we will not move it to India directly. We will look at the location and requests of customer and find a country to 'outsource' to. For France this could be somewhere in Africa because the french language is spoken in large parts of Africa as a second language. South America and Spain and Portugal are a good mix. India is not ruled out but also other options are possible and Gartner is recognizing this and is sharing the vision that this is a great way to go.

"Gartner said: “Although some traditional providers are still trying to build critical mass in India, all providers must invest further in nearshore or possibly low-cost onshore European delivery centers. India is no longer the only delivery source.”

Therefore, in this regard, our pan-European presence and growing visibility in Latin America and Africa - which exemplifies our Rightshore model - are among our strongest differentiators."